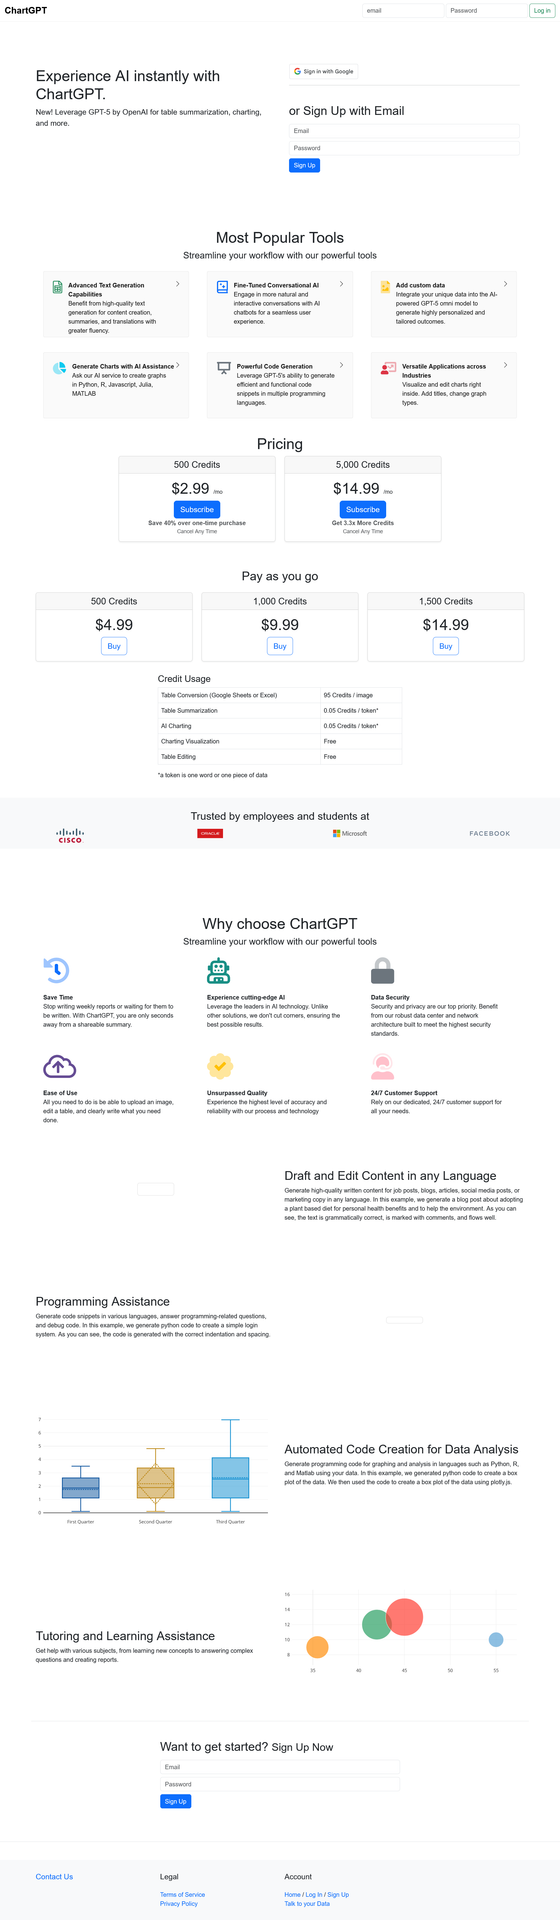
Chart GPT turns your data into stunning visualizations instantly — no coding required.
This free AI tool uses advanced technology to create charts, graphs, and data visualizations from simple text prompts. Whether you’re a business analyst, student, or researcher, this powerful assistant transforms complex data into clear visual insights in seconds. Explore this and other AI assistants on Almma.
What is Chart GPT?
Chart GPT is an AI-powered assistant that generates charts, graphs, and data visualizations through natural language conversation. Instead of wrestling with Excel formulas or learning complex visualization software, you simply describe what you want — and the tool creates it.
Built on advanced GPT technology with integrated DALL-E image generation and web browsing capabilities, Chart GPT has facilitated over 200,000 conversations, helping users visualize their data effortlessly.
Key capabilities:
- Generate bar charts, line graphs, pie charts, scatter plots, and more
- Analyze uploaded spreadsheets and CSV files
- Browse the web to gather real-time data for visualization
- Create presentation-ready graphics with DALL-E integration
- Export visualizations in multiple formats
Who Uses Chart GPT?
Business Professionals
Create quarterly reports, sales dashboards, and executive presentations without waiting for your data team. This AI assistant turns raw numbers into boardroom-ready visuals in minutes.
Students & Researchers
Visualize research data, create thesis graphics, and build compelling presentations. The tool supports academic workflows with accurate, publication-quality charts.
Content Creators & Marketers
Transform statistics into shareable infographics for social media, blog posts, and marketing materials. Make data storytelling accessible to your audience.
Data Analysts
Prototype visualizations quickly before building production dashboards. Use Chart GPT for rapid exploration and stakeholder communication.
Chart GPT Features
| Feature | Description |
|---|---|
| Natural Language Input | Describe your chart in plain English — no formulas or code needed |
| File Upload Support | Upload CSV, Excel, or text files for instant analysis |
| Web Browsing | Pull real-time data from the web to create up-to-date visualizations |
| DALL-E Integration | Generate custom graphics and enhanced visual elements |
| Multiple Chart Types | Bar, line, pie, scatter, histogram, area charts, and more |
| Code Generation | Get Python, R, JavaScript, Julia, or MATLAB code for your visualizations |
How to Use The Tool
Step 1: Describe Your Data
Describe what data you want to visualize. You can type it directly, upload a file, or ask it to research data online.
Example prompt: “Create a bar chart showing the top 10 countries by GDP in 2024.”
Step 2: Refine Your Visualization
The assistant generates an initial visualization. Ask for adjustments — change colors, add labels, switch chart types, or modify the data range.
Example prompt: “Make it a horizontal bar chart with blue bars and add the exact GDP values as labels.”
Step 3: Export and Use
Download your finished chart or copy the generated code to use in your own projects. Charts are ready for presentations, reports, or web publishing.
Chart GPT vs. Alternatives
| Feature | Chart GPT | Traditional Tools (Excel, Tableau) |
Other AI Tools |
|---|---|---|---|
| Learning Curve | None — use natural language | Steep — requires training | Varies |
| Speed | Seconds | Minutes to hours | Seconds |
| Cost | Free | $0–$70+/month | $10–$30/month |
| Web Data Access | ✅ Yes | ❌ Manual import | Limited |
| Code Export | ✅ Python, R, JS, Julia, MATLAB | ❌ No | Limited |
| File Upload | ✅ Yes | ✅ Yes | Varies |
Real-World Use Cases
Sales Report Automation
“I upload my monthly sales CSV and ask Chart GPT to create a comparison chart against last quarter. What used to take me 2 hours now takes 2 minutes.”
Academic Research
“For my thesis, I needed to visualize survey data across multiple demographics. Chart GPT generated publication-ready figures and gave me the Python code to reproduce them.”
Marketing Presentations
“Our marketing team uses this AI visualization tool to turn campaign metrics into visuals for client presentations. The DALL-E integration helps us create branded graphics that match our style guide.”
Frequently Asked Questions
Is Chart GPT free to use?
Yes. Chart GPT is available at no cost through Almma. You can start creating visualizations immediately without a subscription or credit card.
What file formats does it support?
Chart GPT accepts CSV files, Excel (.xlsx, .xls) spreadsheets, and plain-text data. You can also paste data directly into the conversation.
Does it access live data from the internet?
Yes. Chart GPT includes web-browsing capabilities, enabling it to research and pull up-to-date data from online sources to create visualizations.
What programming languages can it generate code for?
Chart GPT can output visualization code in Python (matplotlib, seaborn, plotly), R (ggplot2), JavaScript (D3.js, Chart.js), Julia, and MATLAB.
How accurate are its visualizations?
ChartGPT generates visualizations based on the data you provide or data it retrieves from the web. Always verify critical data points, especially for business or academic use.
Can I use the visualizations commercially?
Yes. Visualizations you create with Chart GPT can be used in commercial presentations, reports, and publications.
Get Started with Chart GPT
Stop struggling with spreadsheet formulas and complex visualization software. Chart GPT makes data visualization accessible to everyone.
200,000+ conversations | Free to use | No signup required
Leave a Reply